Visualizzazione
Visualisation
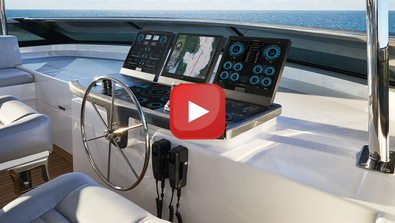
Today´s yachts have implemented lots of different systems that require being monitored and controlled. As almost every system comes with an own control panel and display, the number of such devices on a bridge rapidly grows to a point where the operator may lose the overview. Especially when regarding safety aspects, this can lead to damages and accidents.
At Böning Automationstechnologie GmbH & Co. KG we have increasingly taken these demands into account for years by developing detailed, sophisticated, and user friendly visualizations.
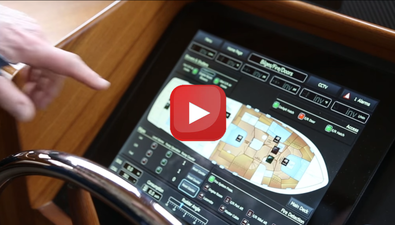
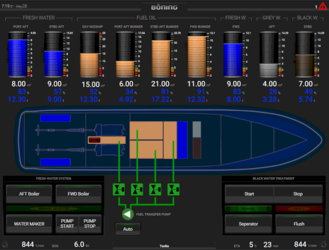
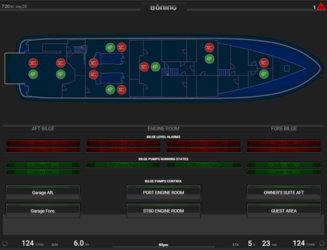
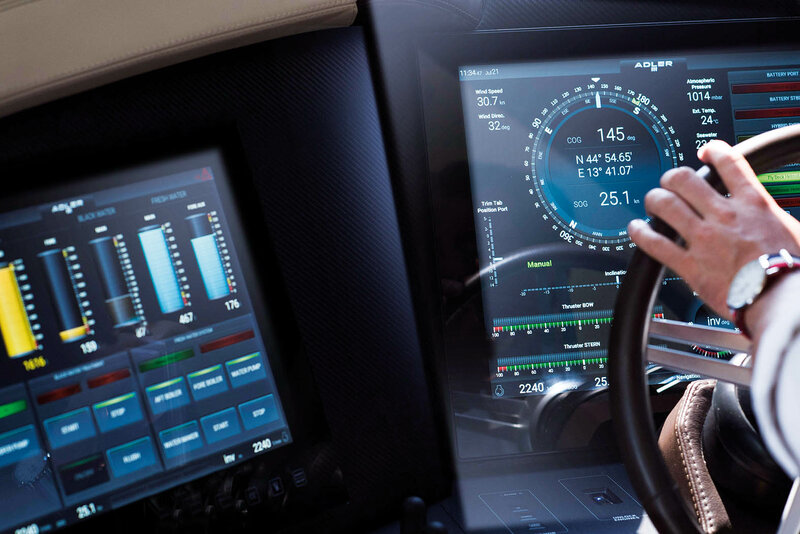
For each project, the visualizations are tailored to the customer’s individual wishes, the data are graphically rendered, and visualized by integrating them into the original ship graphics and master plans. Commands can be transmitted to the corresponding units via touch screen technology or separate control units.
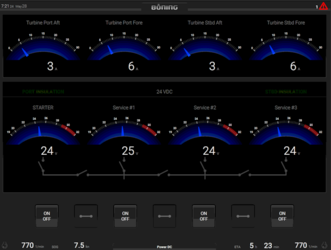
Böning’s monitoring and display system allows for the capture and visualization of a multitude of sensor data on board a ship. The monitored data are compiled according to customer specifications and can be expanded to nearly any number. Depending on system size and scope of delivery, various functions can be displayed and controlled.
Visualisation examples
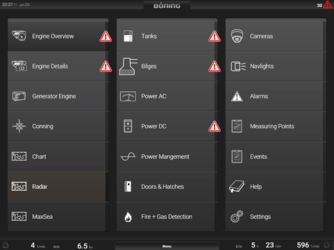
Main Menu
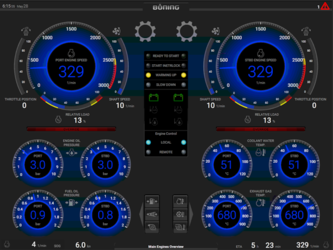
A menu page shows all pages available in the system with the possibility to directly access the desired page. Every page shows the most important engine data in special rows, granting the operator knowledge about the vessel status at any time.
Various displays are operated simultaneously, visualizing all kind of system data. And still the operator can select the pages he needs for the very moment – for each single display independent and with just a push of a button.
Engine Digital
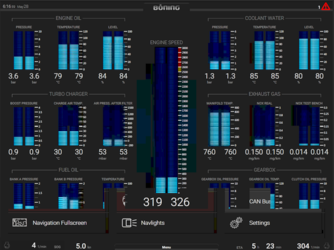
Most advanced technology requires according display instruments. A digital visualization in bar graphs is state-of-the-art, giving the operator all required information. The value itself is not the most important, but crossing critical limits is. The operator sees with the first sight all those values beyond default, as they are indicated by according colours (yellow for Warning, red for Alarm).
Power AC
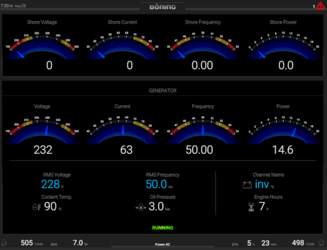
Keeping the energy balance aboard a vessel is essential for functionality and safety. Failure of the generators leads to subsequent system failures, and I the worst case to a NUC situation. Thus monitoring the generator states is an important part of the bridge crew´s duties. A logical and easily visible display facilitates the task.
NavLights
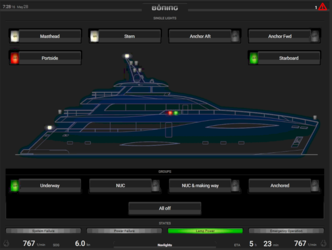
International shipping regulations require a constant supervision of the navigation light system. A visualization on a display offers many advantages compared to mechanical displays used up to now, providing information about from lamp status, error indications and many more. In combination with the navigation light monitoring system by Böning Automationstechnologie GmbH & Co. KG the operator has a comfortable, reliable and type approved system at his disposal.
Conning
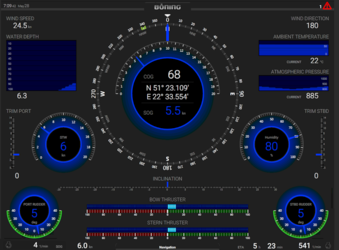
Conventional bridges have the many displays for position, wind gauge and other similar information widely spread all over the panels. Visualizing these data on one single page facilitates the work for the operator and – what is most important – gives the possibility to react immediately if an emergency situation arises.
Cameras
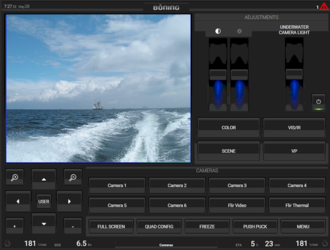
Knowing what happens aboard the vessel or in the near surrounding may be important. Cameras in selected positions monitor areas and sections aboard a vessel. Comfortably controlled from then bridge, the display shows the selected section of the vessel. In addition up to four camera pictures can be displayed simultaneously – for a maximum security.
Alarms
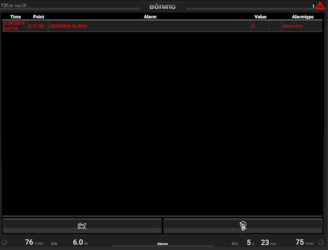
In case of a failure the operator has to be informed immediately and with as many information regarding the failure as possible. A key feature of the visualization system is the presentation of alarms with according information on a special page. The operator can now inform the according crew members for finding the root cause for the alarm and removing this cause.
Events
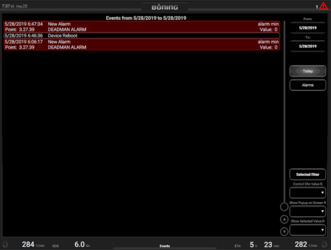
All events that occur during a specified period of time are displayed in a table. The operator has a continued overview of all events. The display allows scrolling in the table, to switch between current and older events and even between the event pages – with only one single push of a button.


